 |
Vespucci
1.0.0
|
|
Vespucci
1.0.0
|
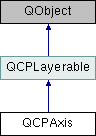
Manages a single axis inside a QCustomPlot. More...
#include <qcustomplot.h>
Public Types | |
| enum | AxisType { atLeft = 0x01, atRight = 0x02, atTop = 0x04, atBottom = 0x08 } |
| enum | LabelType { ltNumber, ltDateTime } |
| enum | LabelSide { lsInside, lsOutside } |
| enum | ScaleType { stLinear, stLogarithmic } |
| enum | SelectablePart { spNone = 0, spAxis = 0x001, spTickLabels = 0x002, spAxisLabel = 0x004 } |
Signals | |
| void | ticksRequest () |
| void | rangeChanged (const QCPRange &newRange) |
| void | rangeChanged (const QCPRange &newRange, const QCPRange &oldRange) |
| void | scaleTypeChanged (QCPAxis::ScaleType scaleType) |
| void | selectionChanged (const QCPAxis::SelectableParts &parts) |
| void | selectableChanged (const QCPAxis::SelectableParts &parts) |
 Signals inherited from QCPLayerable Signals inherited from QCPLayerable | |
| void | layerChanged (QCPLayer *newLayer) |
Public Member Functions | |
| QCPAxis (QCPAxisRect *parent, AxisType type) | |
| virtual | ~QCPAxis () |
| AxisType | axisType () const |
| QCPAxisRect * | axisRect () const |
| ScaleType | scaleType () const |
| double | scaleLogBase () const |
| const QCPRange | range () const |
| bool | rangeReversed () const |
| bool | autoTicks () const |
| int | autoTickCount () const |
| bool | autoTickLabels () const |
| bool | autoTickStep () const |
| bool | autoSubTicks () const |
| bool | ticks () const |
| bool | tickLabels () const |
| int | tickLabelPadding () const |
| LabelType | tickLabelType () const |
| QFont | tickLabelFont () const |
| QColor | tickLabelColor () const |
| double | tickLabelRotation () const |
| LabelSide | tickLabelSide () const |
| QString | dateTimeFormat () const |
| Qt::TimeSpec | dateTimeSpec () const |
| QString | numberFormat () const |
| int | numberPrecision () const |
| double | tickStep () const |
| QVector< double > | tickVector () const |
| QVector< QString > | tickVectorLabels () const |
| int | tickLengthIn () const |
| int | tickLengthOut () const |
| int | subTickCount () const |
| int | subTickLengthIn () const |
| int | subTickLengthOut () const |
| QPen | basePen () const |
| QPen | tickPen () const |
| QPen | subTickPen () const |
| QFont | labelFont () const |
| QColor | labelColor () const |
| QString | label () const |
| int | labelPadding () const |
| int | padding () const |
| int | offset () const |
| SelectableParts | selectedParts () const |
| SelectableParts | selectableParts () const |
| QFont | selectedTickLabelFont () const |
| QFont | selectedLabelFont () const |
| QColor | selectedTickLabelColor () const |
| QColor | selectedLabelColor () const |
| QPen | selectedBasePen () const |
| QPen | selectedTickPen () const |
| QPen | selectedSubTickPen () const |
| QCPLineEnding | lowerEnding () const |
| QCPLineEnding | upperEnding () const |
| QCPGrid * | grid () const |
| Q_SLOT void | setScaleType (QCPAxis::ScaleType type) |
| void | setScaleLogBase (double base) |
| Q_SLOT void | setRange (const QCPRange &range) |
| void | setRange (double lower, double upper) |
| void | setRange (double position, double size, Qt::AlignmentFlag alignment) |
| void | setRangeLower (double lower) |
| void | setRangeUpper (double upper) |
| void | setRangeReversed (bool reversed) |
| void | setAutoTicks (bool on) |
| void | setAutoTickCount (int approximateCount) |
| void | setAutoTickLabels (bool on) |
| void | setAutoTickStep (bool on) |
| void | setAutoSubTicks (bool on) |
| void | setTicks (bool show) |
| void | setTickLabels (bool show) |
| void | setTickLabelPadding (int padding) |
| void | setTickLabelType (LabelType type) |
| void | setTickLabelFont (const QFont &font) |
| void | setTickLabelColor (const QColor &color) |
| void | setTickLabelRotation (double degrees) |
| void | setTickLabelSide (LabelSide side) |
| void | setDateTimeFormat (const QString &format) |
| void | setDateTimeSpec (const Qt::TimeSpec &timeSpec) |
| void | setNumberFormat (const QString &formatCode) |
| void | setNumberPrecision (int precision) |
| void | setTickStep (double step) |
| void | setTickVector (const QVector< double > &vec) |
| void | setTickVectorLabels (const QVector< QString > &vec) |
| void | setTickLength (int inside, int outside=0) |
| void | setTickLengthIn (int inside) |
| void | setTickLengthOut (int outside) |
| void | setSubTickCount (int count) |
| void | setSubTickLength (int inside, int outside=0) |
| void | setSubTickLengthIn (int inside) |
| void | setSubTickLengthOut (int outside) |
| void | setBasePen (const QPen &pen) |
| void | setTickPen (const QPen &pen) |
| void | setSubTickPen (const QPen &pen) |
| void | setLabelFont (const QFont &font) |
| void | setLabelColor (const QColor &color) |
| void | setLabel (const QString &str) |
| void | setLabelPadding (int padding) |
| void | setPadding (int padding) |
| void | setOffset (int offset) |
| void | setSelectedTickLabelFont (const QFont &font) |
| void | setSelectedLabelFont (const QFont &font) |
| void | setSelectedTickLabelColor (const QColor &color) |
| void | setSelectedLabelColor (const QColor &color) |
| void | setSelectedBasePen (const QPen &pen) |
| void | setSelectedTickPen (const QPen &pen) |
| void | setSelectedSubTickPen (const QPen &pen) |
| Q_SLOT void | setSelectableParts (const QCPAxis::SelectableParts &selectableParts) |
| Q_SLOT void | setSelectedParts (const QCPAxis::SelectableParts &selectedParts) |
| void | setLowerEnding (const QCPLineEnding &ending) |
| void | setUpperEnding (const QCPLineEnding &ending) |
| virtual double | selectTest (const QPointF &pos, bool onlySelectable, QVariant *details=0) const |
| Qt::Orientation | orientation () const |
| void | moveRange (double diff) |
| void | scaleRange (double factor, double center) |
| void | setScaleRatio (const QCPAxis *otherAxis, double ratio=1.0) |
| void | rescale (bool onlyVisiblePlottables=false) |
| double | pixelToCoord (double value) const |
| double | coordToPixel (double value) const |
| SelectablePart | getPartAt (const QPointF &pos) const |
| QList< QCPAbstractPlottable * > | plottables () const |
| QList< QCPGraph * > | graphs () const |
| QList< QCPAbstractItem * > | items () const |
| Public Member Functions inherited from QCPLayerable | |
| QCPLayerable (QCustomPlot *plot, QString targetLayer=QString(), QCPLayerable *parentLayerable=0) | |
| ~QCPLayerable () | |
| bool | visible () const |
| QCustomPlot * | parentPlot () const |
| QCPLayerable * | parentLayerable () const |
| QCPLayer * | layer () const |
| bool | antialiased () const |
| void | setVisible (bool on) |
| Q_SLOT bool | setLayer (QCPLayer *layer) |
| bool | setLayer (const QString &layerName) |
| void | setAntialiased (bool enabled) |
| bool | realVisibility () const |
Static Public Member Functions | |
| static AxisType | marginSideToAxisType (QCP::MarginSide side) |
| static Qt::Orientation | orientation (AxisType type) |
| static AxisType | opposite (AxisType type) |
Protected Member Functions | |
| virtual void | setupTickVectors () |
| virtual void | generateAutoTicks () |
| virtual int | calculateAutoSubTickCount (double tickStep) const |
| virtual int | calculateMargin () |
| virtual void | applyDefaultAntialiasingHint (QCPPainter *painter) const |
| virtual void | draw (QCPPainter *painter) |
| virtual QCP::Interaction | selectionCategory () const |
| virtual void | selectEvent (QMouseEvent *event, bool additive, const QVariant &details, bool *selectionStateChanged) |
| virtual void | deselectEvent (bool *selectionStateChanged) |
| void | visibleTickBounds (int &lowIndex, int &highIndex) const |
| double | baseLog (double value) const |
| double | basePow (double value) const |
| QPen | getBasePen () const |
| QPen | getTickPen () const |
| QPen | getSubTickPen () const |
| QFont | getTickLabelFont () const |
| QFont | getLabelFont () const |
| QColor | getTickLabelColor () const |
| QColor | getLabelColor () const |
| Protected Member Functions inherited from QCPLayerable | |
| virtual void | parentPlotInitialized (QCustomPlot *parentPlot) |
| virtual QRect | clipRect () const |
| void | initializeParentPlot (QCustomPlot *parentPlot) |
| void | setParentLayerable (QCPLayerable *parentLayerable) |
| bool | moveToLayer (QCPLayer *layer, bool prepend) |
| void | applyAntialiasingHint (QCPPainter *painter, bool localAntialiased, QCP::AntialiasedElement overrideElement) const |
Friends | |
| class | QCustomPlot |
| class | QCPGrid |
| class | QCPAxisRect |
Manages a single axis inside a QCustomPlot.
Usually doesn't need to be instantiated externally. Access QCustomPlot's default four axes via QCustomPlot::xAxis (bottom), QCustomPlot::yAxis (left), QCustomPlot::xAxis2 (top) and QCustomPlot::yAxis2 (right).
Axes are always part of an axis rect, see QCPAxisRect.


Definition at line 985 of file qcustomplot.h.
| enum QCPAxis::AxisType |
Defines at which side of the axis rect the axis will appear. This also affects how the tick marks are drawn, on which side the labels are placed etc.
Definition at line 1047 of file qcustomplot.h.
| enum QCPAxis::LabelSide |
Defines on which side of the axis the tick labels (numbers) shall appear.
| Enumerator | |
|---|---|
| lsInside |
Tick labels will be displayed inside the axis rect and clipped to the inner axis rect. |
| lsOutside |
Tick labels will be displayed outside the axis rect. |
Definition at line 1069 of file qcustomplot.h.
| enum QCPAxis::LabelType |
When automatic tick label generation is enabled (setAutoTickLabels), defines how the coordinate of the tick is interpreted, i.e. translated into a string.
| Enumerator | |
|---|---|
| ltNumber |
Tick coordinate is regarded as normal number and will be displayed as such. (see setNumberFormat) |
| ltDateTime |
Tick coordinate is regarded as a date/time (seconds since 1970-01-01T00:00:00 UTC) and will be displayed and formatted as such. (for details, see setDateTimeFormat) |
Definition at line 1060 of file qcustomplot.h.
| enum QCPAxis::ScaleType |
Defines the scale of an axis.
| Enumerator | |
|---|---|
| stLinear |
Linear scaling. |
| stLogarithmic |
Logarithmic scaling with correspondingly transformed plots and (major) tick marks at every base power (see setScaleLogBase). |
Definition at line 1077 of file qcustomplot.h.
Defines the selectable parts of an axis.
| Enumerator | |
|---|---|
| spNone |
None of the selectable parts. |
| spAxis |
The axis backbone and tick marks. |
| spTickLabels |
Tick labels (numbers) of this axis (as a whole, not individually) |
| spAxisLabel |
The axis label. |
Definition at line 1085 of file qcustomplot.h.
|
explicit |
Constructs an Axis instance of Type type for the axis rect parent.
Usually it isn't necessary to instantiate axes directly, because you can let QCustomPlot create them for you with QCPAxisRect::addAxis. If you want to use own QCPAxis-subclasses however, create them manually and then inject them also via QCPAxisRect::addAxis.
Definition at line 4001 of file qcustomplot.cpp.
|
virtual |
Definition at line 4080 of file qcustomplot.cpp.
|
protectedvirtual |
Implements QCPLayerable.
Definition at line 5785 of file qcustomplot.cpp.
|
inline |
Definition at line 1107 of file qcustomplot.h.
|
inline |
Definition at line 1104 of file qcustomplot.h.
|
inline |
Definition at line 1105 of file qcustomplot.h.
|
inline |
Definition at line 1103 of file qcustomplot.h.
|
inline |
Definition at line 1106 of file qcustomplot.h.
|
inline |
Definition at line 1098 of file qcustomplot.h.
|
inline |
Definition at line 1097 of file qcustomplot.h.
|
protected |
Definition at line 5900 of file qcustomplot.cpp.
|
inline |
Definition at line 1128 of file qcustomplot.h.
|
protected |
Definition at line 5912 of file qcustomplot.cpp.
|
protectedvirtual |
Definition at line 5693 of file qcustomplot.cpp.
|
protectedvirtual |
Definition at line 6001 of file qcustomplot.cpp.
| double QCPAxis::coordToPixel | ( | double | value | ) | const |
Transforms value, in coordinates of the axis, to pixel coordinates of the QCustomPlot widget.
Definition at line 5334 of file qcustomplot.cpp.
|
inline |
Definition at line 1116 of file qcustomplot.h.
|
inline |
Definition at line 1117 of file qcustomplot.h.
|
protectedvirtual |
Reimplemented from QCPLayerable.
Definition at line 5764 of file qcustomplot.cpp.
|
protectedvirtual |
Implements QCPLayerable.
Definition at line 5795 of file qcustomplot.cpp.
|
protectedvirtual |
Definition at line 5617 of file qcustomplot.cpp.
|
protected |
Definition at line 5922 of file qcustomplot.cpp.
|
protected |
Definition at line 5982 of file qcustomplot.cpp.
|
protected |
Definition at line 5962 of file qcustomplot.cpp.
| QCPAxis::SelectablePart QCPAxis::getPartAt | ( | const QPointF & | pos | ) | const |
Returns the part of the axis that is hit by pos (in pixels). The return value of this function is independent of the user-selectable parts defined with setSelectableParts. Further, this function does not change the current selection state of the axis.
If the axis is not visible (setVisible), this function always returns spNone.
Definition at line 5392 of file qcustomplot.cpp.
|
protected |
Definition at line 5942 of file qcustomplot.cpp.
|
protected |
Definition at line 5972 of file qcustomplot.cpp.
|
protected |
Definition at line 5952 of file qcustomplot.cpp.
|
protected |
Definition at line 5932 of file qcustomplot.cpp.
| QList< QCPGraph * > QCPAxis::graphs | ( | ) | const |
Returns a list of all the graphs that have this axis as key or value axis.
Definition at line 5445 of file qcustomplot.cpp.
|
inline |
Returns the QCPGrid instance belonging to this axis. Access it to set details about the way the grid is displayed.
Definition at line 1148 of file qcustomplot.h.
| QList< QCPAbstractItem * > QCPAxis::items | ( | ) | const |
Returns a list of all the items that are associated with this axis. An item is considered associated with an axis if at least one of its positions uses the axis as key or value axis.
Definition at line 5464 of file qcustomplot.cpp.
|
inline |
Definition at line 1133 of file qcustomplot.h.
|
inline |
Definition at line 1132 of file qcustomplot.h.
|
inline |
Definition at line 1131 of file qcustomplot.h.
| int QCPAxis::labelPadding | ( | ) | const |
Definition at line 4142 of file qcustomplot.cpp.
| QCPLineEnding QCPAxis::lowerEnding | ( | ) | const |
Definition at line 4154 of file qcustomplot.cpp.
|
static |
Transforms a margin side to the logically corresponding axis type. (QCP::msLeft to QCPAxis::atLeft, QCP::msRight to QCPAxis::atRight, etc.)
Definition at line 5488 of file qcustomplot.cpp.
| void QCPAxis::moveRange | ( | double | diff | ) |
If the scale type (setScaleType) is stLinear, diff is added to the lower and upper bounds of the range. The range is simply moved by diff.
If the scale type is stLogarithmic, the range bounds are multiplied by diff. This corresponds to an apparent "linear" move in logarithmic scaling by a distance of log(diff).
Definition at line 5160 of file qcustomplot.cpp.
| QString QCPAxis::numberFormat | ( | ) | const |
Definition at line 4104 of file qcustomplot.cpp.
|
inline |
Definition at line 1119 of file qcustomplot.h.
| int QCPAxis::offset | ( | ) | const |
Definition at line 4148 of file qcustomplot.cpp.
|
static |
Returns the axis type that describes the opposite axis of an axis with the specified type.
Definition at line 5505 of file qcustomplot.cpp.
|
inline |
Returns the orientation of this axis. The axis orientation (horizontal or vertical) is deduced from the axis type (left, top, right or bottom).
Definition at line 1211 of file qcustomplot.h.
|
inlinestatic |
Returns the orientation of the specified axis type
Definition at line 1224 of file qcustomplot.h.
|
inline |
Definition at line 1135 of file qcustomplot.h.
| double QCPAxis::pixelToCoord | ( | double | value | ) | const |
Transforms value, in pixel coordinates of the QCustomPlot widget, to axis coordinates.
Definition at line 5296 of file qcustomplot.cpp.
| QList< QCPAbstractPlottable * > QCPAxis::plottables | ( | ) | const |
|
inline |
Definition at line 1101 of file qcustomplot.h.
|
signal |
This signal is emitted when the range of this axis has changed. You can connect it to the setRange slot of another axis to communicate the new range to the other axis, in order for it to be synchronized.
This is an overloaded member function, provided for convenience. It differs from the above function only in what argument(s) it accepts.
Additionally to the new range, this signal also provides the previous range held by the axis as oldRange.
|
inline |
Definition at line 1102 of file qcustomplot.h.
| void QCPAxis::rescale | ( | bool | onlyVisiblePlottables = false | ) |
Changes the axis range such that all plottables associated with this axis are fully visible in that dimension.
Definition at line 5247 of file qcustomplot.cpp.
|
inline |
Definition at line 1100 of file qcustomplot.h.
| void QCPAxis::scaleRange | ( | double | factor, |
| double | center | ||
| ) |
Scales the range of this axis by factor around the coordinate center. For example, if factor is 2.0, center is 1.0, then the axis range will double its size, and the point at coordinate 1.0 won't have changed its position in the QCustomPlot widget (i.e. coordinates around 1.0 will have moved symmetrically closer to 1.0).
Definition at line 5183 of file qcustomplot.cpp.
|
inline |
Definition at line 1099 of file qcustomplot.h.
|
signal |
This signal is emitted when the scale type changes, by calls to setScaleType
|
signal |
This signal is emitted when the selectability changes, by calls to setSelectableParts
|
inline |
Definition at line 1138 of file qcustomplot.h.
|
inline |
Definition at line 1143 of file qcustomplot.h.
|
inline |
Definition at line 1142 of file qcustomplot.h.
|
inline |
Definition at line 1140 of file qcustomplot.h.
|
inline |
Definition at line 1137 of file qcustomplot.h.
|
inline |
Definition at line 1145 of file qcustomplot.h.
|
inline |
Definition at line 1141 of file qcustomplot.h.
|
inline |
Definition at line 1139 of file qcustomplot.h.
|
inline |
Definition at line 1144 of file qcustomplot.h.
|
protectedvirtual |
Reimplemented from QCPLayerable.
Definition at line 5750 of file qcustomplot.cpp.
|
protectedvirtual |
Reimplemented from QCPLayerable.
Definition at line 6046 of file qcustomplot.cpp.
|
signal |
This signal is emitted when the selection state of this axis has changed, either by user interaction or by a direct call to setSelectedParts.
|
virtual |
This function is used to decide whether a click hits a layerable object or not.
pos is a point in pixel coordinates on the QCustomPlot surface. This function returns the shortest pixel distance of this point to the object. If the object is either invisible or the distance couldn't be determined, -1.0 is returned. Further, if onlySelectable is true and the object is not selectable, -1.0 is returned, too.
If the item is represented not by single lines but by an area like QCPItemRect or QCPItemText, a click inside the area returns a constant value greater zero (typically the selectionTolerance of the parent QCustomPlot multiplied by 0.99). If the click lies outside the area, this function returns -1.0.
Providing a constant value for area objects allows selecting line objects even when they are obscured by such area objects, by clicking close to the lines (i.e. closer than 0.99*selectionTolerance).
The actual setting of the selection state is not done by this function. This is handled by the parent QCustomPlot when the mouseReleaseEvent occurs, and the finally selected object is notified via the selectEvent/deselectEvent methods.
details is an optional output parameter. Every layerable subclass may place any information in details. This information will be passed to selectEvent when the parent QCustomPlot decides on the basis of this selectTest call, that the object was successfully selected. The subsequent call to selectEvent will carry the details. This is useful for multi-part objects (like QCPAxis). This way, a possibly complex calculation to decide which part was clicked is only done once in selectTest. The result (i.e. the actually clicked part) can then be placed in details. So in the subsequent selectEvent, the decision which part was selected doesn't have to be done a second time for a single selection operation.
You may pass 0 as details to indicate that you are not interested in those selection details.
Reimplemented from QCPLayerable.
Definition at line 5408 of file qcustomplot.cpp.
| void QCPAxis::setAutoSubTicks | ( | bool | on | ) |
Sets whether the number of sub ticks in one tick interval is determined automatically. This works, as long as the tick step mantissa is a multiple of 0.5. When setAutoTickStep is enabled, this is always the case.
When on is set to false, you may set the sub tick count with setSubTickCount manually.
Definition at line 4495 of file qcustomplot.cpp.
| void QCPAxis::setAutoTickCount | ( | int | approximateCount | ) |
When setAutoTickStep is true, approximateCount determines how many ticks should be generated in the visible range, approximately.
It's not guaranteed that this number of ticks is met exactly, but approximately within a tolerance of about two.
Only values greater than zero are accepted as approximateCount.
Definition at line 4428 of file qcustomplot.cpp.
| void QCPAxis::setAutoTickLabels | ( | bool | on | ) |
Sets whether the tick labels are generated automatically. Depending on the tick label type (ltNumber or ltDateTime), the labels will either show the coordinate as floating point number (setNumberFormat), or a date/time formatted according to setDateTimeFormat.
If on is set to false, you should provide the tick labels via setTickVectorLabels. This is usually used in a combination with setAutoTicks set to false for complete control over tick positions and labels, e.g. when the ticks should be at multiples of pi and show "2pi", "3pi" etc. as tick labels.
If you need dynamically calculated tick vectors (and possibly tick label vectors), set the vectors in a slot connected to the ticksRequest signal.
Definition at line 4456 of file qcustomplot.cpp.
| void QCPAxis::setAutoTicks | ( | bool | on | ) |
Sets whether the tick positions should be calculated automatically (either from an automatically generated tick step or a tick step provided manually via setTickStep, see setAutoTickStep).
If on is set to false, you must provide the tick positions manually via setTickVector. For these manual ticks you may let QCPAxis generate the appropriate labels automatically by leaving setAutoTickLabels set to true. If you also wish to control the displayed labels manually, set setAutoTickLabels to false and provide the label strings with setTickVectorLabels.
If you need dynamically calculated tick vectors (and possibly tick label vectors), set the vectors in a slot connected to the ticksRequest signal.
Definition at line 4408 of file qcustomplot.cpp.
| void QCPAxis::setAutoTickStep | ( | bool | on | ) |
Sets whether the tick step, i.e. the interval between two (major) ticks, is calculated automatically. If on is set to true, the axis finds a tick step that is reasonable for human readable plots.
The number of ticks the algorithm aims for within the visible range can be specified with setAutoTickCount.
If on is set to false, you may set the tick step manually with setTickStep.
Definition at line 4477 of file qcustomplot.cpp.
| void QCPAxis::setBasePen | ( | const QPen & | pen | ) |
Sets the pen, the axis base line is drawn with.
Definition at line 4937 of file qcustomplot.cpp.
| void QCPAxis::setDateTimeFormat | ( | const QString & | format | ) |
Sets the format in which dates and times are displayed as tick labels, if setTickLabelType is ltDateTime. for details about the format string, see the documentation of QDateTime::toString().
Newlines can be inserted with "\n".
Definition at line 4641 of file qcustomplot.cpp.
| void QCPAxis::setDateTimeSpec | ( | const Qt::TimeSpec & | timeSpec | ) |
Sets the time spec that is used for the date time values when setTickLabelType is ltDateTime.
The default value of QDateTime objects (and also QCustomPlot) is Qt::LocalTime. However, if the date time values passed to QCustomPlot are given in the UTC spec, set timeSpec to Qt::UTC to get the correct axis labels.
Definition at line 4660 of file qcustomplot.cpp.
| void QCPAxis::setLabel | ( | const QString & | str | ) |
Sets the text of the axis label that will be shown below/above or next to the axis, depending on its orientation. To disable axis labels, pass an empty string as str.
Definition at line 4990 of file qcustomplot.cpp.
| void QCPAxis::setLabelColor | ( | const QColor & | color | ) |
Sets the color of the axis label.
Definition at line 4981 of file qcustomplot.cpp.
| void QCPAxis::setLabelFont | ( | const QFont & | font | ) |
Sets the font of the axis label.
Definition at line 4967 of file qcustomplot.cpp.
| void QCPAxis::setLabelPadding | ( | int | padding | ) |
Sets the distance between the tick labels and the axis label.
Definition at line 5004 of file qcustomplot.cpp.
| void QCPAxis::setLowerEnding | ( | const QCPLineEnding & | ending | ) |
Sets the style for the lower axis ending. See the documentation of QCPLineEnding for available styles.
For horizontal axes, this method refers to the left ending, for vertical axes the bottom ending. Note that this meaning does not change when the axis range is reversed with setRangeReversed.
Definition at line 5133 of file qcustomplot.cpp.
| void QCPAxis::setNumberFormat | ( | const QString & | formatCode | ) |
Sets the number format for the numbers drawn as tick labels (if tick label type is ltNumber). This formatCode is an extended version of the format code used e.g. by QString::number() and QLocale::toString(). For reference about that, see the "Argument Formats" section in the detailed description of the QString class. formatCode is a string of one, two or three characters. The first character is identical to the normal format code used by Qt. In short, this means: 'e'/'E' scientific format, 'f' fixed format, 'g'/'G' scientific or fixed, whichever is shorter.
The second and third characters are optional and specific to QCustomPlot:
If the first char was 'e' or 'g', numbers are/might be displayed in the scientific format, e.g. "5.5e9", which is ugly in a plot. So when the second char of formatCode is set to 'b' (for "beautiful"), those exponential numbers are formatted in a more natural way, i.e. "5.5
[multiplication sign] 10 [superscript] 9". By default, the multiplication sign is a centered dot. If instead a cross should be shown (as is usual in the USA), the third char of formatCode can be set to 'c'. The inserted multiplication signs are the UTF-8 characters 215 (0xD7) for the cross and 183 (0xB7) for the dot.
If the scale type (setScaleType) is stLogarithmic and the formatCode uses the 'b' option (beautifully typeset decimal powers), the display usually is "1 [multiplication sign] 10 [superscript] n", which looks unnatural for logarithmic scaling (the "1 [multiplication sign]" part). To only display the decimal power, set the number precision to zero with setNumberPrecision.
Examples for formatCode:
g normal format code behaviour. If number is small, fixed format is used, if number is large, normal scientific format is used gb If number is small, fixed format is used, if number is large, scientific format is used with beautifully typeset decimal powers and a dot as multiplication sign ebc All numbers are in scientific format with beautifully typeset decimal power and a cross as multiplication sign fb illegal format code, since fixed format doesn't support (or need) beautifully typeset decimal powers. Format code will be reduced to 'f'. hello illegal format code, since first char is not 'e', 'E', 'f', 'g' or 'G'. Current format code will not be changed. Definition at line 4701 of file qcustomplot.cpp.
| void QCPAxis::setNumberPrecision | ( | int | precision | ) |
Sets the precision of the tick label numbers. See QLocale::toString(double i, char f, int prec) for details. The effect of precisions are most notably for number Formats starting with 'e', see setNumberFormat
If the scale type (setScaleType) is stLogarithmic and the number format (setNumberFormat) uses the 'b' format code (beautifully typeset decimal powers), the display usually is "1 [multiplication sign] 10 [superscript] n", which looks unnatural for logarithmic scaling (the redundant "1 [multiplication sign]" part). To only display the decimal power "10 [superscript] n", set precision to zero.
Definition at line 4767 of file qcustomplot.cpp.
| void QCPAxis::setOffset | ( | int | offset | ) |
Sets the offset the axis has to its axis rect side.
If an axis rect side has multiple axes and automatic margin calculation is enabled for that side, only the offset of the inner most axis has meaning (even if it is set to be invisible). The offset of the other, outer axes is controlled automatically, to place them at appropriate positions.
Definition at line 5040 of file qcustomplot.cpp.
| void QCPAxis::setPadding | ( | int | padding | ) |
Sets the padding of the axis.
When QCPAxisRect::setAutoMargins is enabled, the padding is the additional outer most space, that is left blank.
The axis padding has no meaning if QCPAxisRect::setAutoMargins is disabled.
Definition at line 5023 of file qcustomplot.cpp.
| void QCPAxis::setRange | ( | const QCPRange & | range | ) |
Sets the range of the axis.
This slot may be connected with the rangeChanged signal of another axis so this axis is always synchronized with the other axis range, when it changes.
To invert the direction of an axis, use setRangeReversed.
Definition at line 4216 of file qcustomplot.cpp.
| void QCPAxis::setRange | ( | double | lower, |
| double | upper | ||
| ) |
This is an overloaded member function, provided for convenience. It differs from the above function only in what argument(s) it accepts.
Sets the lower and upper bound of the axis range.
To invert the direction of an axis, use setRangeReversed.
There is also a slot to set a range, see setRange(const QCPRange &range).
Definition at line 4287 of file qcustomplot.cpp.
| void QCPAxis::setRange | ( | double | position, |
| double | size, | ||
| Qt::AlignmentFlag | alignment | ||
| ) |
This is an overloaded member function, provided for convenience. It differs from the above function only in what argument(s) it accepts.
Sets the range of the axis.
The position coordinate indicates together with the alignment parameter, where the new range will be positioned. size defines the size of the new axis range. alignment may be Qt::AlignLeft, Qt::AlignRight or Qt::AlignCenter. This will cause the left border, right border, or center of the range to be aligned with position. Any other values of alignment will default to Qt::AlignCenter.
Definition at line 4319 of file qcustomplot.cpp.
| void QCPAxis::setRangeLower | ( | double | lower | ) |
Sets the lower bound of the axis range. The upper bound is not changed.
Definition at line 4333 of file qcustomplot.cpp.
| void QCPAxis::setRangeReversed | ( | bool | reversed | ) |
Sets whether the axis range (direction) is displayed reversed. Normally, the values on horizontal axes increase left to right, on vertical axes bottom to top. When reversed is set to true, the direction of increasing values is inverted.
Note that the range and data interface stays the same for reversed axes, e.g. the lower part of the setRange interface will still reference the mathematically smaller number than the upper part.
Definition at line 4384 of file qcustomplot.cpp.
| void QCPAxis::setRangeUpper | ( | double | upper | ) |
Sets the upper bound of the axis range. The lower bound is not changed.
Definition at line 4356 of file qcustomplot.cpp.
| void QCPAxis::setScaleLogBase | ( | double | base | ) |
If setScaleType is set to stLogarithmic, base will be the logarithm base of the scaling. In logarithmic axis scaling, major tick marks appear at all powers of base.
Properties like tick step (setTickStep) don't apply in logarithmic scaling. If you wish a decimal base but less major ticks, consider choosing base 100, 1000 or even higher.
Definition at line 4197 of file qcustomplot.cpp.
| void QCPAxis::setScaleRatio | ( | const QCPAxis * | otherAxis, |
| double | ratio = 1.0 |
||
| ) |
Scales the range of this axis to have a certain scale ratio to otherAxis. The scaling will be done around the center of the current axis range.
For example, if ratio is 1, this axis is the yAxis and otherAxis is xAxis, graphs plotted with those axes will appear in a 1:1 aspect ratio, independent of the aspect ratio the axis rect has.
This is an operation that changes the range of this axis once, it doesn't fix the scale ratio indefinitely. Note that calling this function in the constructor of the QCustomPlot's parent won't have the desired effect, since the widget dimensions aren't defined yet, and a resizeEvent will follow.
Definition at line 5223 of file qcustomplot.cpp.
| void QCPAxis::setScaleType | ( | QCPAxis::ScaleType | type | ) |
Sets whether the axis uses a linear scale or a logarithmic scale. If type is set to stLogarithmic, the logarithm base can be set with setScaleLogBase. In logarithmic axis scaling, major tick marks appear at all powers of the logarithm base. Properties like tick step (setTickStep) don't apply in logarithmic scaling. If you wish a decimal base but less major ticks, consider choosing a logarithm base of 100, 1000 or even higher.
If type is stLogarithmic and the number format (setNumberFormat) uses the 'b' option (beautifully typeset decimal powers), the display usually is "1 [multiplication sign] 10 [superscript] n", which looks unnatural for logarithmic scaling (the "1 [multiplication sign]" part). To only display the decimal power, set the number precision to zero with setNumberPrecision.
Definition at line 4178 of file qcustomplot.cpp.
| void QCPAxis::setSelectableParts | ( | const QCPAxis::SelectableParts & | selectableParts | ) |
Sets whether the user can (de-)select the parts in selectable by clicking on the QCustomPlot surface. (When QCustomPlot::setInteractions contains iSelectAxes.)
However, even when selectable is set to a value not allowing the selection of a specific part, it is still possible to set the selection of this part manually, by calling setSelectedParts directly.
Definition at line 4245 of file qcustomplot.cpp.
| void QCPAxis::setSelectedBasePen | ( | const QPen & | pen | ) |
Sets the pen that is used to draw the axis base line when selected.
Definition at line 5098 of file qcustomplot.cpp.
| void QCPAxis::setSelectedLabelColor | ( | const QColor & | color | ) |
Sets the color that is used for the axis label when it is selected.
Definition at line 5088 of file qcustomplot.cpp.
| void QCPAxis::setSelectedLabelFont | ( | const QFont & | font | ) |
Sets the font that is used for the axis label when it is selected.
Definition at line 5064 of file qcustomplot.cpp.
| void QCPAxis::setSelectedParts | ( | const QCPAxis::SelectableParts & | selectedParts | ) |
Sets the selected state of the respective axis parts described by SelectablePart. When a part is selected, it uses a different pen/font.
The entire selection mechanism for axes is handled automatically when QCustomPlot::setInteractions contains iSelectAxes. You only need to call this function when you wish to change the selection state manually.
This function can change the selection state of a part, independent of the setSelectableParts setting.
emits the selectionChanged signal when selected is different from the previous selection state.
Definition at line 4269 of file qcustomplot.cpp.
| void QCPAxis::setSelectedSubTickPen | ( | const QPen & | pen | ) |
Sets the pen that is used to draw the subticks when selected.
Definition at line 5118 of file qcustomplot.cpp.
| void QCPAxis::setSelectedTickLabelColor | ( | const QColor & | color | ) |
Sets the color that is used for tick labels when they are selected.
Definition at line 5075 of file qcustomplot.cpp.
| void QCPAxis::setSelectedTickLabelFont | ( | const QFont & | font | ) |
Sets the font that is used for tick labels when they are selected.
Definition at line 5050 of file qcustomplot.cpp.
| void QCPAxis::setSelectedTickPen | ( | const QPen & | pen | ) |
Sets the pen that is used to draw the (major) ticks when selected.
Definition at line 5108 of file qcustomplot.cpp.
| void QCPAxis::setSubTickCount | ( | int | count | ) |
Sets the number of sub ticks in one (major) tick step. A sub tick count of three for example, divides the tick intervals in four sub intervals.
By default, the number of sub ticks is chosen automatically in a reasonable manner as long as the mantissa of the tick step is a multiple of 0.5. When setAutoTickStep is enabled, this is always the case.
If you want to disable automatic sub tick count and use this function to set the count manually, see setAutoSubTicks.
Definition at line 4883 of file qcustomplot.cpp.
| void QCPAxis::setSubTickLength | ( | int | inside, |
| int | outside = 0 |
||
| ) |
Sets the length of the subticks in pixels. inside is the length the subticks will reach inside the plot and outside is the length they will reach outside the plot. If outside is greater than zero, the tick labels and axis label will increase their distance to the axis accordingly, so they won't collide with the ticks.
Definition at line 4896 of file qcustomplot.cpp.
| void QCPAxis::setSubTickLengthIn | ( | int | inside | ) |
Sets the length of the inward subticks in pixels. inside is the length the subticks will reach inside the plot.
Definition at line 4908 of file qcustomplot.cpp.
| void QCPAxis::setSubTickLengthOut | ( | int | outside | ) |
Sets the length of the outward subticks in pixels. outside is the length the subticks will reach outside the plot. If outside is greater than zero, the tick labels will increase their distance to the axis accordingly, so they won't collide with the ticks.
Definition at line 4923 of file qcustomplot.cpp.
| void QCPAxis::setSubTickPen | ( | const QPen & | pen | ) |
Sets the pen, subtick marks will be drawn with.
Definition at line 4957 of file qcustomplot.cpp.
| void QCPAxis::setTickLabelColor | ( | const QColor & | color | ) |
Sets the color of the tick labels.
Definition at line 4593 of file qcustomplot.cpp.
| void QCPAxis::setTickLabelFont | ( | const QFont & | font | ) |
Sets the font of the tick labels.
Definition at line 4579 of file qcustomplot.cpp.
| void QCPAxis::setTickLabelPadding | ( | int | padding | ) |
Sets the distance between the axis base line (including any outward ticks) and the tick labels.
Definition at line 4535 of file qcustomplot.cpp.
| void QCPAxis::setTickLabelRotation | ( | double | degrees | ) |
Sets the rotation of the tick labels. If degrees is zero, the labels are drawn normally. Else, the tick labels are drawn rotated by degrees clockwise. The specified angle is bound to values from -90 to 90 degrees.
If degrees is exactly -90, 0 or 90, the tick labels are centered on the tick coordinate. For other angles, the label is drawn with an offset such that it seems to point toward or away from the tick mark.
Definition at line 4611 of file qcustomplot.cpp.
| void QCPAxis::setTickLabels | ( | bool | show | ) |
Sets whether tick labels are displayed. Tick labels are the numbers drawn next to tick marks.
Definition at line 4522 of file qcustomplot.cpp.
| void QCPAxis::setTickLabelSide | ( | LabelSide | side | ) |
Sets whether the tick labels (numbers) shall appear inside or outside the axis rect.
The usual and default setting is lsOutside. Very compact plots sometimes require tick labels to be inside the axis rect, to save space. If side is set to lsInside, the tick labels appear on the inside are additionally clipped to the axis rect.
Definition at line 4627 of file qcustomplot.cpp.
| void QCPAxis::setTickLabelType | ( | LabelType | type | ) |
Sets whether the tick labels display numbers or dates/times.
If type is set to ltNumber, the format specifications of setNumberFormat apply.
If type is set to ltDateTime, the format specifications of setDateTimeFormat apply.
In QCustomPlot, date/time coordinates are double numbers representing the seconds since 1970-01-01T00:00:00 UTC. This format can be retrieved from QDateTime objects with the QDateTime::toTime_t() function. Since this only gives a resolution of one second, there is also the QDateTime::toMSecsSinceEpoch() function which returns the timespan described above in milliseconds. Divide its return value by 1000.0 to get a value with the format needed for date/time plotting, with a resolution of one millisecond.
Using the toMSecsSinceEpoch function allows dates that go back to 2nd January 4713 B.C. (represented by a negative number), unlike the toTime_t function, which works with unsigned integers and thus only goes back to 1st January 1970. So both for range and accuracy, use of toMSecsSinceEpoch()/1000.0 should be preferred as key coordinate for date/time axes.
Definition at line 4565 of file qcustomplot.cpp.
| void QCPAxis::setTickLength | ( | int | inside, |
| int | outside = 0 |
||
| ) |
Sets the length of the ticks in pixels. inside is the length the ticks will reach inside the plot and outside is the length they will reach outside the plot. If outside is greater than zero, the tick labels and axis label will increase their distance to the axis accordingly, so they won't collide with the ticks.
Definition at line 4836 of file qcustomplot.cpp.
| void QCPAxis::setTickLengthIn | ( | int | inside | ) |
Sets the length of the inward ticks in pixels. inside is the length the ticks will reach inside the plot.
Definition at line 4848 of file qcustomplot.cpp.
| void QCPAxis::setTickLengthOut | ( | int | outside | ) |
Sets the length of the outward ticks in pixels. outside is the length the ticks will reach outside the plot. If outside is greater than zero, the tick labels and axis label will increase their distance to the axis accordingly, so they won't collide with the ticks.
Definition at line 4863 of file qcustomplot.cpp.
| void QCPAxis::setTickPen | ( | const QPen & | pen | ) |
Sets the pen, tick marks will be drawn with.
Definition at line 4947 of file qcustomplot.cpp.
| void QCPAxis::setTicks | ( | bool | show | ) |
Sets whether tick marks are displayed.
Note that setting show to false does not imply that tick labels are invisible, too. To achieve that, see setTickLabels.
Definition at line 4510 of file qcustomplot.cpp.
| void QCPAxis::setTickStep | ( | double | step | ) |
If setAutoTickStep is set to false, use this function to set the tick step manually. The tick step is the interval between (major) ticks, in plot coordinates.
Definition at line 4781 of file qcustomplot.cpp.
| void QCPAxis::setTickVector | ( | const QVector< double > & | vec | ) |
If you want full control over what ticks (and possibly labels) the axes show, this function is used to set the coordinates at which ticks will appear.setAutoTicks must be disabled, else the provided tick vector will be overwritten with automatically generated tick coordinates upon replot. The labels of the ticks can be generated automatically when setAutoTickLabels is left enabled. If it is disabled, you can set the labels manually with setTickVectorLabels.
vec is a vector containing the positions of the ticks, in plot coordinates.
Definition at line 4803 of file qcustomplot.cpp.
| void QCPAxis::setTickVectorLabels | ( | const QVector< QString > & | vec | ) |
If you want full control over what ticks and labels the axes show, this function is used to set a number of QStrings that will be displayed at the tick positions which you need to provide with setTickVector. These two vectors should have the same size. (Note that you need to disable setAutoTicks and setAutoTickLabels first.)
vec is a vector containing the labels of the ticks. The entries correspond to the respective indices in the tick vector, passed via setTickVector.
Definition at line 4821 of file qcustomplot.cpp.
| void QCPAxis::setUpperEnding | ( | const QCPLineEnding & | ending | ) |
Sets the style for the upper axis ending. See the documentation of QCPLineEnding for available styles.
For horizontal axes, this method refers to the right ending, for vertical axes the top ending. Note that this meaning does not change when the axis range is reversed with setRangeReversed.
Definition at line 5148 of file qcustomplot.cpp.
|
protectedvirtual |
Definition at line 5524 of file qcustomplot.cpp.
|
inline |
Definition at line 1125 of file qcustomplot.h.
| int QCPAxis::subTickLengthIn | ( | ) | const |
Definition at line 4130 of file qcustomplot.cpp.
| int QCPAxis::subTickLengthOut | ( | ) | const |
Definition at line 4136 of file qcustomplot.cpp.
|
inline |
Definition at line 1130 of file qcustomplot.h.
|
inline |
Definition at line 1113 of file qcustomplot.h.
|
inline |
Definition at line 1112 of file qcustomplot.h.
| int QCPAxis::tickLabelPadding | ( | ) | const |
Definition at line 4086 of file qcustomplot.cpp.
| double QCPAxis::tickLabelRotation | ( | ) | const |
Definition at line 4092 of file qcustomplot.cpp.
|
inline |
Definition at line 1109 of file qcustomplot.h.
| QCPAxis::LabelSide QCPAxis::tickLabelSide | ( | ) | const |
Definition at line 4098 of file qcustomplot.cpp.
|
inline |
Definition at line 1111 of file qcustomplot.h.
| int QCPAxis::tickLengthIn | ( | ) | const |
Definition at line 4118 of file qcustomplot.cpp.
| int QCPAxis::tickLengthOut | ( | ) | const |
Definition at line 4124 of file qcustomplot.cpp.
|
inline |
Definition at line 1129 of file qcustomplot.h.
|
inline |
Definition at line 1108 of file qcustomplot.h.
|
signal |
This signal is emitted when setAutoTicks is false and the axis is about to generate tick labels for a replot.
Modifying the tick positions can be done with setTickVector. If you also want to control the tick labels, set setAutoTickLabels to false and also provide the labels with setTickVectorLabels.
If you only want static ticks you probably don't need this signal, since you can just set the tick vector (and possibly tick label vector) once. However, if you want to provide ticks (and maybe labels) dynamically, e.g. depending on the current axis range, connect a slot to this signal and set the vector/vectors there.
|
inline |
Definition at line 1120 of file qcustomplot.h.
|
inline |
Definition at line 1121 of file qcustomplot.h.
|
inline |
Definition at line 1122 of file qcustomplot.h.
| QCPLineEnding QCPAxis::upperEnding | ( | ) | const |
Definition at line 4160 of file qcustomplot.cpp.
|
protected |
Definition at line 5860 of file qcustomplot.cpp.
|
friend |
Definition at line 1319 of file qcustomplot.h.
|
friend |
Definition at line 1318 of file qcustomplot.h.
|
friend |
Definition at line 1317 of file qcustomplot.h.
|
protected |
Definition at line 1268 of file qcustomplot.h.
|
protected |
Definition at line 1267 of file qcustomplot.h.
|
protected |
Definition at line 1253 of file qcustomplot.h.
|
protected |
Definition at line 1268 of file qcustomplot.h.
|
protected |
Definition at line 1268 of file qcustomplot.h.
|
protected |
Definition at line 1280 of file qcustomplot.h.
|
protected |
Definition at line 1239 of file qcustomplot.h.
|
protected |
Definition at line 1238 of file qcustomplot.h.
|
protected |
Definition at line 1244 of file qcustomplot.h.
|
protected |
Definition at line 1286 of file qcustomplot.h.
|
protected |
Definition at line 1285 of file qcustomplot.h.
|
protected |
Definition at line 1258 of file qcustomplot.h.
|
protected |
Definition at line 1259 of file qcustomplot.h.
|
protected |
Definition at line 1279 of file qcustomplot.h.
|
protected |
Definition at line 1281 of file qcustomplot.h.
|
protected |
Definition at line 1248 of file qcustomplot.h.
|
protected |
Definition at line 1250 of file qcustomplot.h.
|
protected |
Definition at line 1249 of file qcustomplot.h.
|
protected |
Definition at line 1281 of file qcustomplot.h.
|
protected |
Definition at line 1262 of file qcustomplot.h.
|
protected |
Definition at line 1261 of file qcustomplot.h.
|
protected |
Definition at line 1260 of file qcustomplot.h.
|
protected |
Definition at line 1242 of file qcustomplot.h.
|
protected |
Definition at line 1241 of file qcustomplot.h.
|
protected |
Definition at line 1273 of file qcustomplot.h.
|
protected |
Definition at line 1274 of file qcustomplot.h.
|
protected |
Definition at line 1276 of file qcustomplot.h.
|
protected |
Definition at line 1276 of file qcustomplot.h.
|
protected |
Definition at line 1275 of file qcustomplot.h.
|
protected |
Definition at line 1243 of file qcustomplot.h.
|
protected |
Definition at line 1244 of file qcustomplot.h.
|
protected |
Definition at line 1250 of file qcustomplot.h.
|
protected |
Definition at line 1249 of file qcustomplot.h.
|
protected |
Definition at line 1243 of file qcustomplot.h.
|
protected |
Definition at line 1271 of file qcustomplot.h.
|
protected |
Definition at line 1257 of file qcustomplot.h.
|
protected |
Definition at line 1256 of file qcustomplot.h.
|
protected |
Definition at line 1270 of file qcustomplot.h.
|
protected |
Definition at line 1267 of file qcustomplot.h.
|
protected |
Definition at line 1271 of file qcustomplot.h.
|
protected |
Definition at line 1284 of file qcustomplot.h.
|
protected |
Definition at line 1257 of file qcustomplot.h.
|
protected |
Definition at line 1256 of file qcustomplot.h.
|
protected |
Definition at line 1253 of file qcustomplot.h.
|
protected |
Definition at line 1255 of file qcustomplot.h.
|
protected |
Definition at line 1270 of file qcustomplot.h.
|
protected |
Definition at line 1265 of file qcustomplot.h.
|
protected |
Definition at line 1266 of file qcustomplot.h.
|
protected |
Definition at line 1282 of file qcustomplot.h.
|
protected |
Definition at line 1283 of file qcustomplot.h.
 1.8.11
